Charting Full Garments Using Illustrator

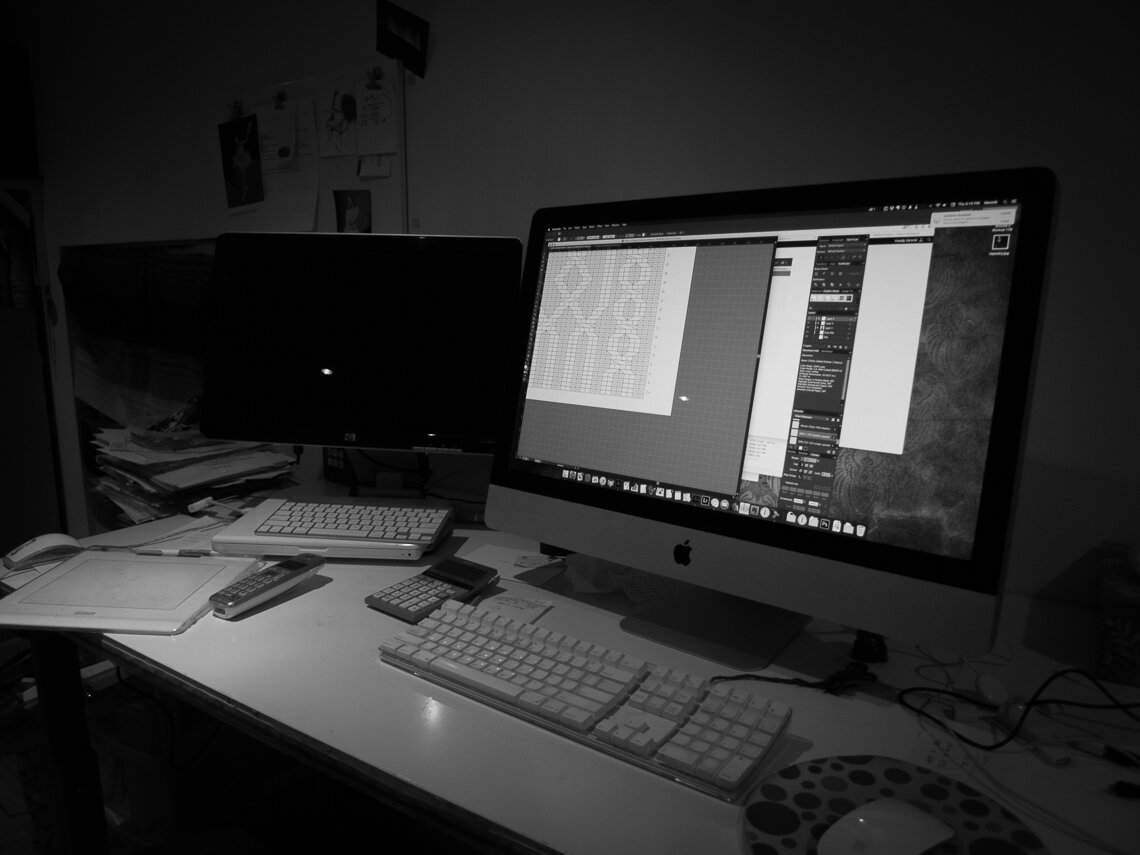 As I've mentioned before, I like to design knitwear by charting the main pattern pieces. Doing so allows me to plan stitch pattern placement exactly and anticipate how shaping will affect various elements. For years, I used Garment Designer and Stitch Painter to generate these charts (and wrote about it briefly).In the recent past, however, both GD and SP were updated to use dongles. I won't be the first or the last to express my dislike of dongles, but I lived with it nevertheless. However, the recent Mac Os 10.10 made both applications completely inoperable. It has been a few months now since I upgraded to Yosemite, and the situation remains the same.So, since last fall, my little 2007 Macbook had to be dusted off and brought back into service. It works, but I find it less than ideal to work on.Which brings me back to Illustrator, which is used far and wide to create schematics and stitch pattern charts such as the one above. Of course, it can most certainly be used to create full garment charts. It's easy enough to calculate how many stitches and rows are needed and create a grid accordingly. But, as I wrote in the post linked above, my method entailed drafting the pattern shapes such as one would for a sewing pattern and exporting into Stitch Painter. It's a very quick and precise method and there is virtually no guesswork involved. I started to wonder if a similar process could be devised using Illustrator.As you've probably guessed already, it can.
 Begin by drawing your pattern pieces. If you aren't familiar with patternmaking, that's ok - these are essentially schematics, drawn actual size. If you are interested in learning to use Illustrator for patternmaking, I recommend Lauren Dahl's course 'Creating PDF Patterns'. But it isn't necessary if only a basic pattern is needed.Once the pieces have been drawn, use a colourful fill without a stroke.
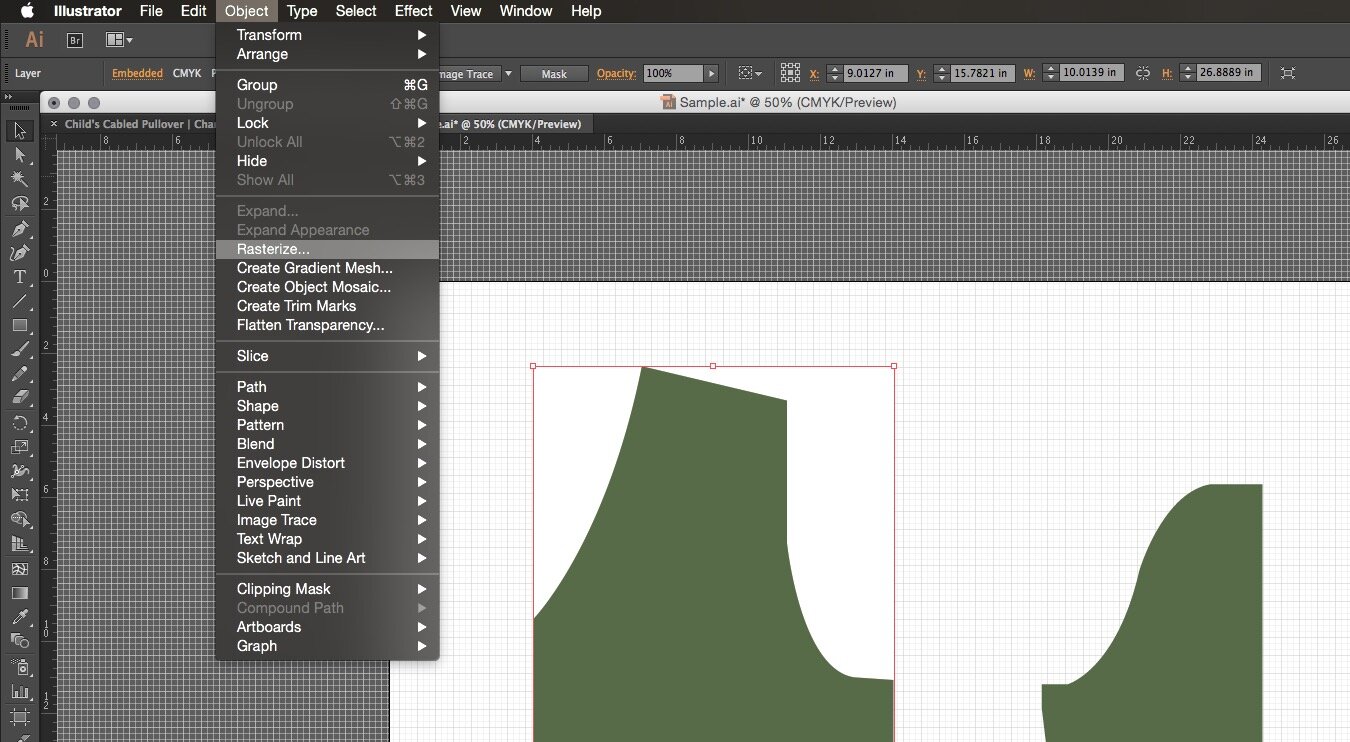 With the piece selected, go to Object>Rasterize. Also make a note of your gauge, and the highest and widest measurements of the piece. These last measurements can be seen in the upper right hand corner next to 'W' and 'H'.
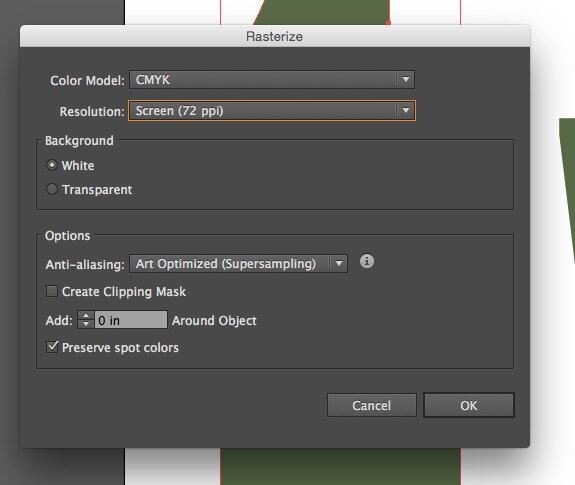 The Rasterizer option box will come up. Choose the lowest resolution and a white background.
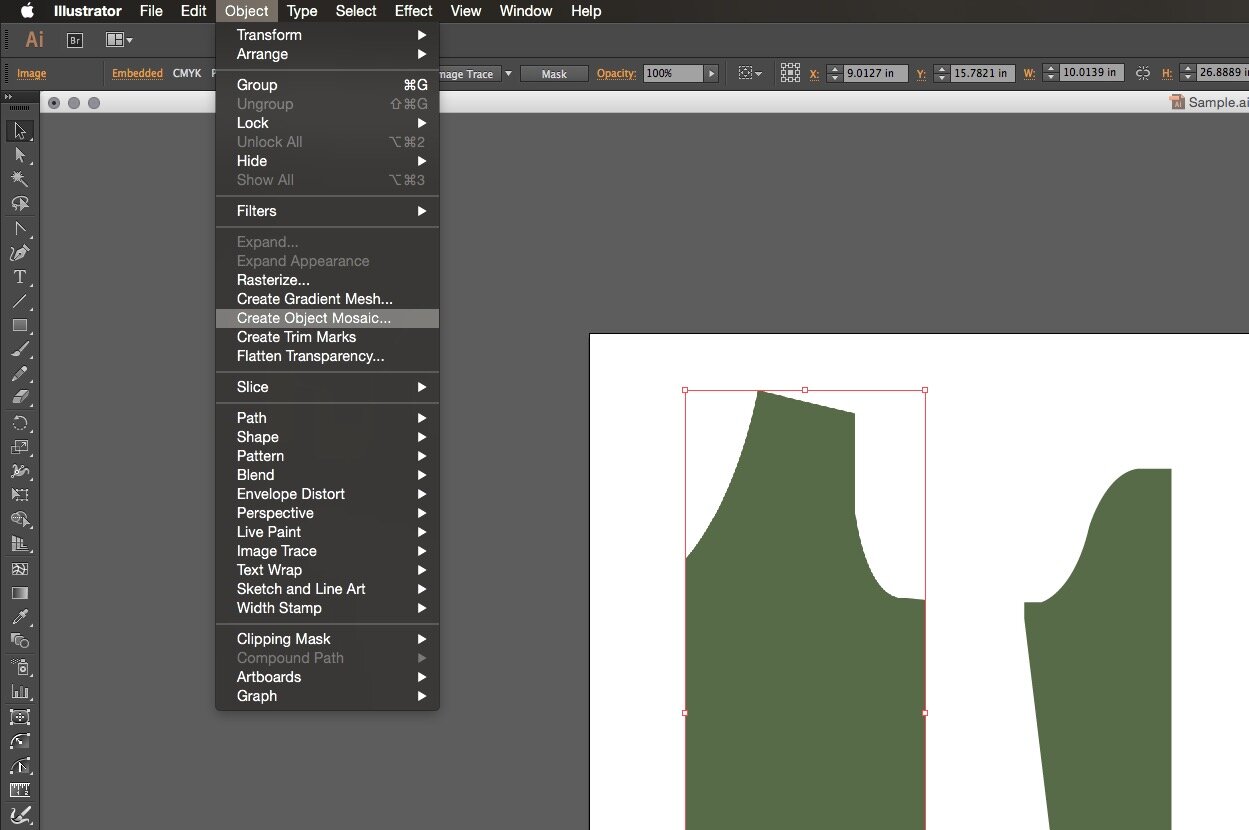 With the piece still selected, go to Object>Create Object Mosaic.
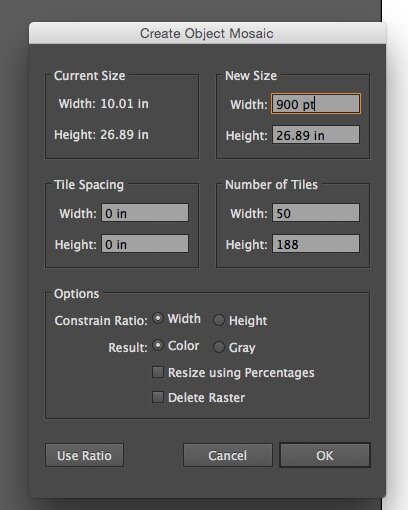 Each tile will represent a stitch; in order to determine how many stitches to cast on, multiply the widest measurement of your piece by your stitch gauge per inch and round to the closest number. Likewise, multiply the highest measurement of your piece by your row gauge. For the example above, I am using a gauge of 5 stitches and 7 rows per inch (50.0696 x 188.23 rounded down to 50 x 188). These numbers belong in the 'Number of Tiles' section.Next, decide how large the tiles ought to be. The symbols I use are all based on a single cell size of 18 points wide by 12 points high, so I've multiplied 50 x 18 to arrive at a result of 900 points.
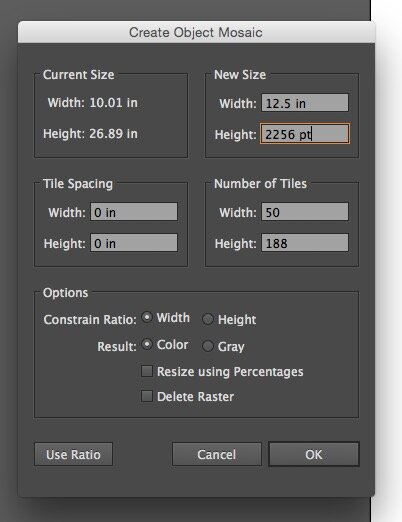 As for the height, 188 x 12 results in 2256 points. Please note that as my document preferences are in inches, I need to specify 'pt' when typing in the desired measurement. It will switch back to the default measurement once the measurement has been entered.
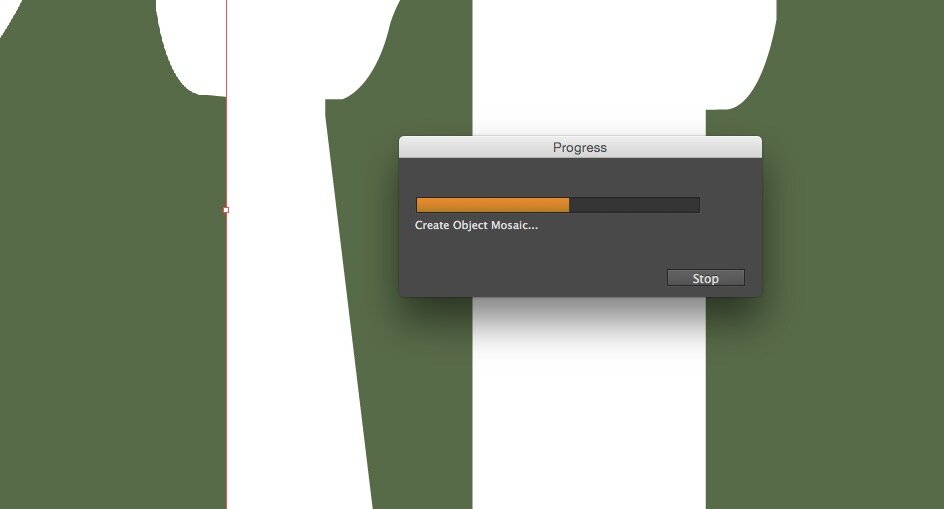
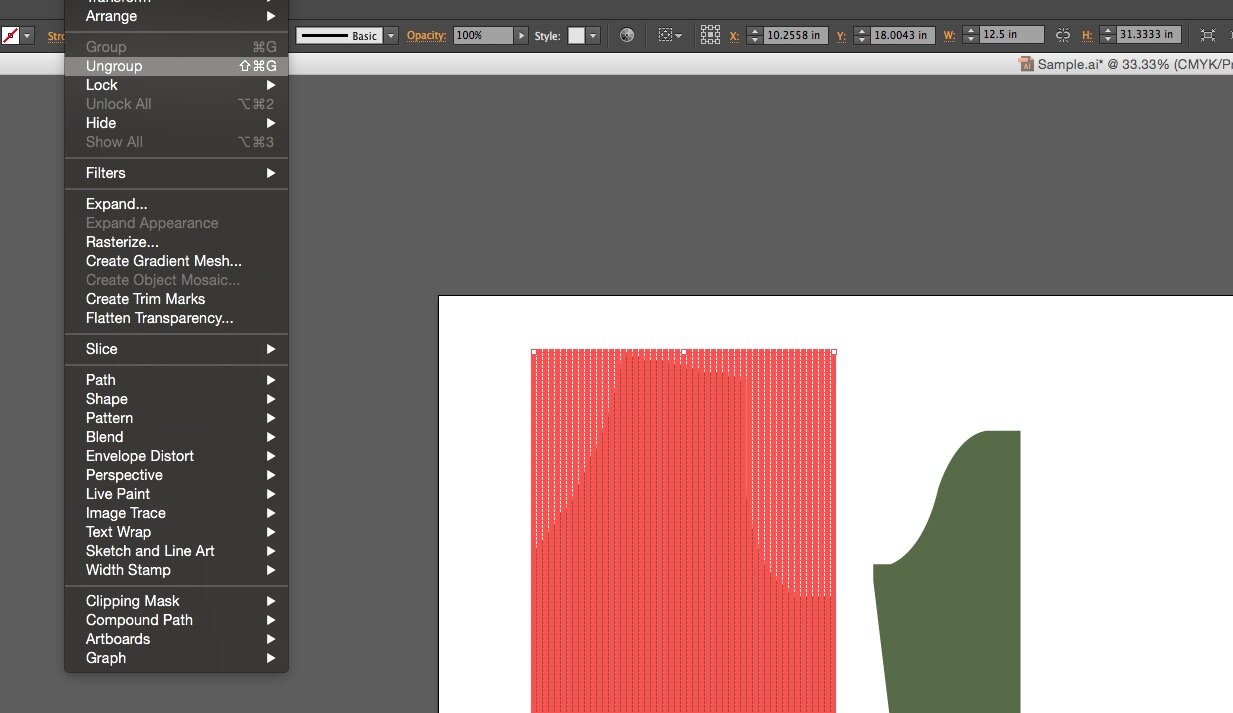 After a little while, your piece will be comprised of many rectangles. Go to Object>Ungroup.
 The result will be close to what is needed, but will need to be cleaned up. I find it easier to delete the empty rectangles, but don't delete them using the selection tool. That takes too long. Yes, I'm impatient.
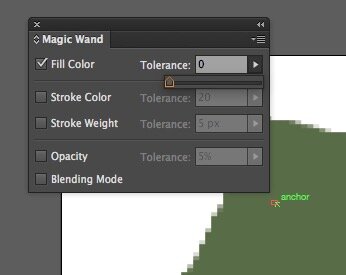 Instead, double click on the magic Wand tool. Check the fill option and set the tolerance to zero.
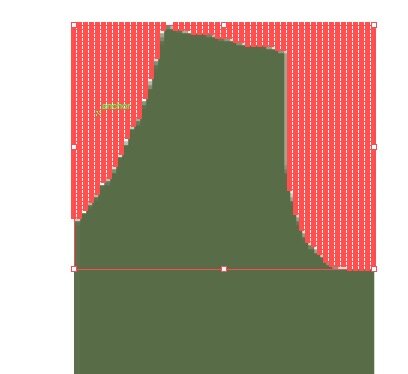 Using the Magic Wand, click on any white rectangles to select all the white rectangles and delete them.
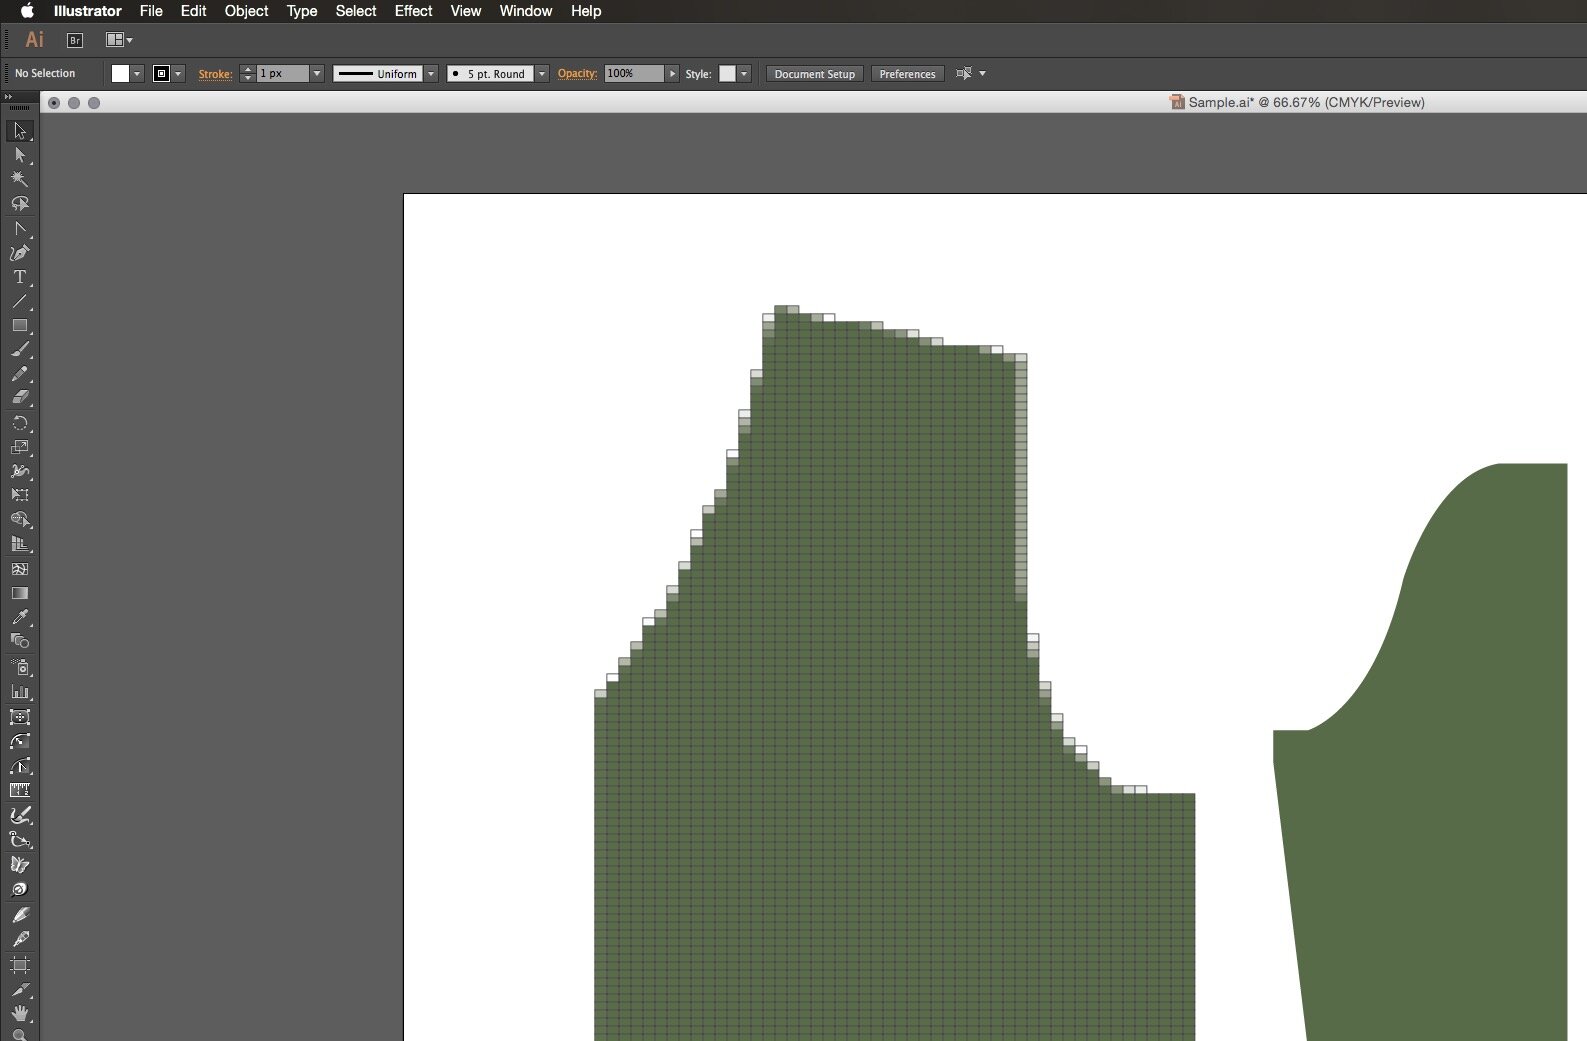 At this point, only the coloured rectangles remain. It has to be cleaned up further to make it knitter friendly by placing the increases and decreases on right side rows, but the general shape is quite close.
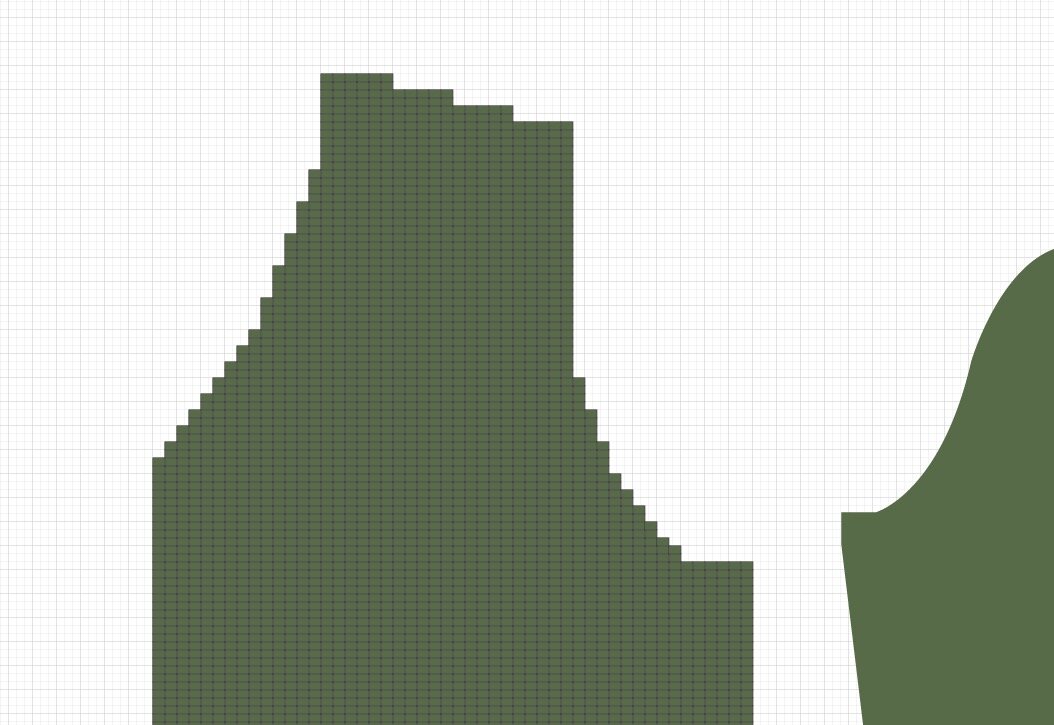 Here it is, mostly clean. Mostly, because I've made an error on the second armhole decrease.
 One of the advantages of this method is that Illustrator can be configured to count stitches and rows. To enable it, go to Window>Document Info. Under the fly-out menu on the upper right hand side, make sure 'Object' is selected. Select a single row or column to see how many stitches are present (under 'Paths'). Note that it must be a single row or column otherwise Illustrator will count everything.
 Another advantage is how easy it is to create a schematic alongside the chart. The original pattern pieces could be used, but wouldn't be as precise as the method that follows - the pattern had to be simplified to adhere to knitter logic, and this results in some changes to the original shape. Using the pen tool and a new layer, trace the pattern piece.
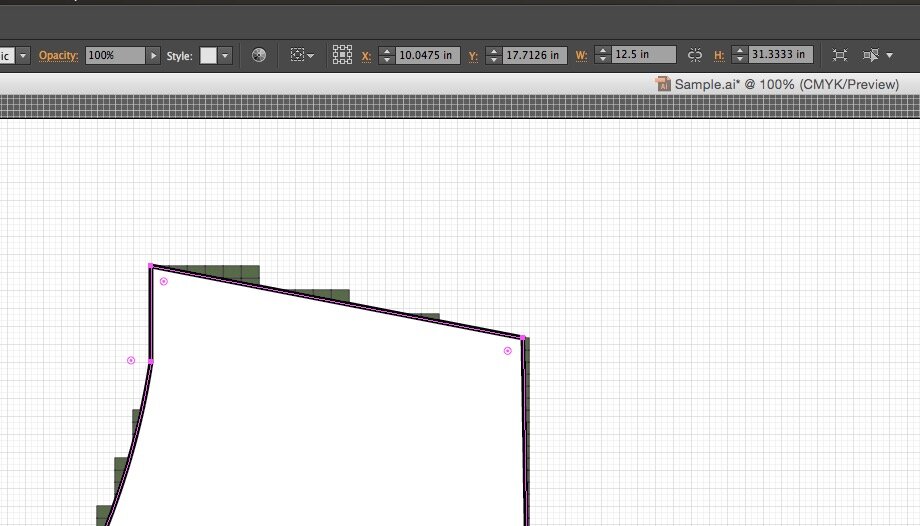 When the tile measurement was set, the overall dimension of the piece changed, as can be seen next to 'W' and 'H'.
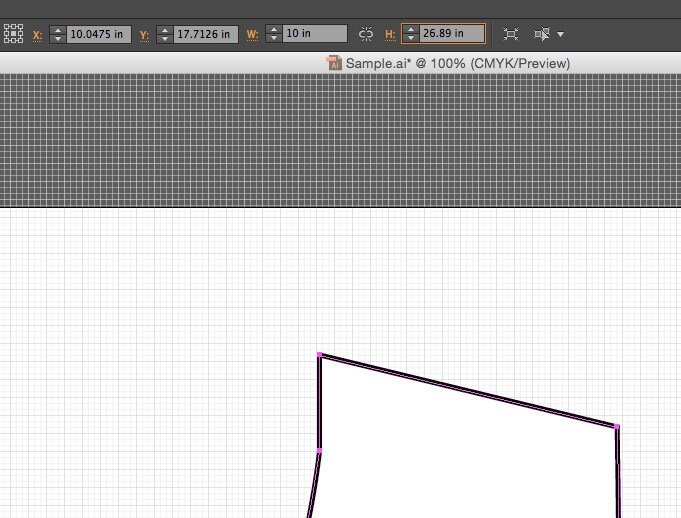 Correct the measurement next to 'W' and 'H' before proceeding with the schematic.
 Draw horizontal and vertical lines wherever a measurement is needed. The shoulder width above is 4.1659, will will be rounded up to 4 1/4".
 I've used Illustrator for this tutorial, but there is probably open source software available which can be used similarly. If you or someone you know is familiar with other types of vector software and know how it can be used, please let us know in the comments. Thank you!